import pandas as pd
import holoviews as hv
from holoviews import opts, dim
from bokeh.sampledata.les_mis import data

hv.extension('bokeh')
hv.output(size=200)

Generate quickly such visualizations
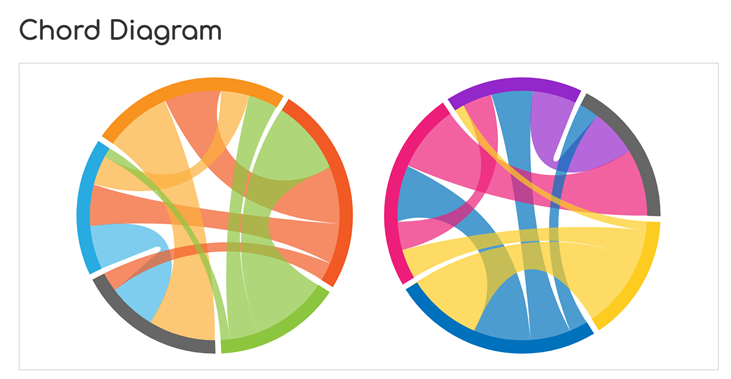
For a larger gallery, a great site Python Graph Gallery

There are examples from https://sites.google.com/site/e90e50fx/home/talent-traffic-chart-with-chord-diagram-in-excel
that we can download and use.
Seems limited to a fixed number of category
https://holoviews.org/reference/elements/bokeh/Chord.html
import pandas as pd
import holoviews as hv
from holoviews import opts, dim
from bokeh.sampledata.les_mis import data
hv.extension('bokeh')
hv.output(size=200)links = pd.DataFrame(data['links'])
print(links.head(3)) source target value
0 1 0 1
1 2 0 8
2 3 0 10pd.DataFrame(data['nodes'])| name | group | |
|---|---|---|
| 0 | Myriel | 1 |
| 1 | Napoleon | 1 |
| 2 | Mlle.Baptistine | 1 |
| 3 | Mme.Magloire | 1 |
| 4 | CountessdeLo | 1 |
| ... | ... | ... |
| 72 | Toussaint | 5 |
| 73 | Child1 | 10 |
| 74 | Child2 | 10 |
| 75 | Brujon | 4 |
| 76 | Mme.Hucheloup | 8 |
77 rows × 2 columns
pd.DataFrame(data['links'])| source | target | value | |
|---|---|---|---|
| 0 | 1 | 0 | 1 |
| 1 | 2 | 0 | 8 |
| 2 | 3 | 0 | 10 |
| 3 | 3 | 2 | 6 |
| 4 | 4 | 0 | 1 |
| ... | ... | ... | ... |
| 249 | 76 | 66 | 1 |
| 250 | 76 | 63 | 1 |
| 251 | 76 | 62 | 1 |
| 252 | 76 | 48 | 1 |
| 253 | 76 | 58 | 1 |
254 rows × 3 columns
# libraries
import pandas as pd
import holoviews as hv
from holoviews import opts, dim
from bokeh.sampledata.les_mis import data

# data set
nodes = hv.Dataset(pd.DataFrame(data['nodes']), 'index')
links = pd.DataFrame(data['links'])


# chord diagram
chord = hv.Chord((links, nodes)).select(value=(5, None))
chord.opts(
    opts.Chord(cmap='Category20', edge_cmap='Category20', edge_color=dim('source').str(),
labels='name', node_color=dim('index').str()))links| source | target | value | |
|---|---|---|---|
| 0 | 1 | 0 | 1 |
| 1 | 2 | 0 | 8 |
| 2 | 3 | 0 | 10 |
| 3 | 3 | 2 | 6 |
| 4 | 4 | 0 | 1 |
| ... | ... | ... | ... |
| 249 | 76 | 66 | 1 |
| 250 | 76 | 63 | 1 |
| 251 | 76 | 62 | 1 |
| 252 | 76 | 48 | 1 |
| 253 | 76 | 58 | 1 |
254 rows × 3 columns
nodes_df = pd.read_excel('~/vbox/janus/temp/chord diagram.xlsx', sheet_name='nodes')
human_links_df = pd.read_excel('~/vbox/janus/temp/chord diagram.xlsx', sheet_name='links', header=[1], index_col=1 )
human_links_df.drop(columns=human_links_df.columns[0], axis=1, inplace=True)nodes_df.head()| name | group | |
|---|---|---|
| 0 | guillaume | 1 |
| 1 | emilie | 1 |
| 2 | sylvain | 1 |
| 3 | teddy | 1 |
| 4 | gilles | 1 |
human_links_df.head()| guillaume | emilie | sylvain | teddy | gilles | gaurav | jerome | jupyter | vscode | iolab | wsl | windows | azure ml | dataiku | gitlab | artifactory | stormshield disk | nas d1 | azure blob storage | |
|---|---|---|---|---|---|---|---|---|---|---|---|---|---|---|---|---|---|---|---|
| name | |||||||||||||||||||
| guillaume | NaN | NaN | NaN | NaN | NaN | NaN | NaN | 9.0 | 1.0 | 3.0 | 7.0 | 0.0 | 1.0 | 1.0 | 8.0 | 3.0 | 5.0 | 5.0 | 0.0 |
| emilie | NaN | NaN | NaN | NaN | NaN | NaN | NaN | 5.0 | 5.0 | 5.0 | NaN | 5.0 | NaN | 0.0 | 5.0 | NaN | 5.0 | 5.0 | NaN |
| sylvain | NaN | NaN | NaN | NaN | NaN | NaN | NaN | 2.0 | 8.0 | 2.0 | 8.0 | NaN | NaN | NaN | 8.0 | 3.0 | 8.0 | NaN | 2.0 |
| teddy | NaN | NaN | NaN | NaN | NaN | NaN | NaN | 5.0 | 5.0 | 10.0 | NaN | NaN | NaN | NaN | 5.0 | NaN | NaN | 10.0 | NaN |
| gilles | NaN | NaN | NaN | NaN | NaN | NaN | NaN | 10.0 | NaN | 10.0 | NaN | NaN | NaN | NaN | 5.0 | NaN | NaN | 10.0 | NaN |
# we have to transpose human_link to something simpler
liste_nonnan = list(human_links_df[human_links_df.notnull()].stack().index)
liste_refs = []
for (name1, name2) in liste_nonnan:
    # print(f'{name1}, {name2}, {human_links_df.loc[name1,name2]}')
    name1_id = nodes_df.index[nodes_df['name'] == name1].tolist()[0]
    name2_id = nodes_df.index[nodes_df['name'] == name2].tolist()[0]
    value = human_links_df.loc[name1,name2]
    # print(f'{name1_id}, {name2_id}, {human_links_df.loc[name1,name2]}\n')
    if value >0:
        liste_refs.append([name1_id, name2_id, value])
links_df = pd.DataFrame(liste_refs, columns=['source', 'target', 'value'])links_df.head()| source | target | value | |
|---|---|---|---|
| 0 | 0 | 7 | 9.0 |
| 1 | 0 | 8 | 1.0 |
| 2 | 0 | 9 | 3.0 |
| 3 | 0 | 10 | 7.0 |
| 4 | 0 | 12 | 1.0 |
# data set
nodes = hv.Dataset(nodes_df, 'index')
links = links_df.copy()


# chord diagram
# chord = hv.Chord((links, nodes)).select(value=(5, None))
chord = hv.Chord((links, nodes))
chord.opts(
    opts.Chord(cmap='Category20', edge_cmap='Category20', edge_color=dim('source').str(),
               labels='name', node_color=dim('index').str()))